-
This email address is being protected from spambots. You need JavaScript enabled to view it.
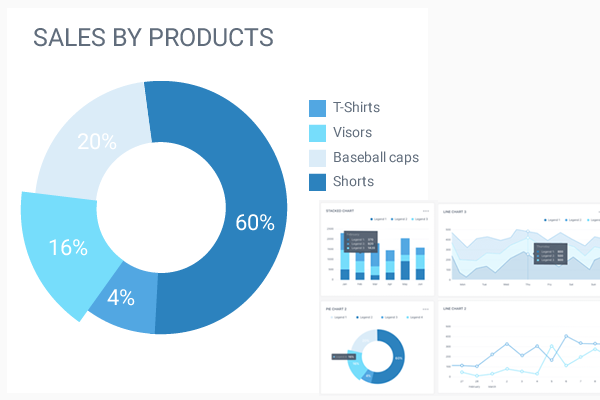
Charts
-
Jueves 10 de Octubre de 2019 | a las 10:00 AM EDT (Nueva York) - 16:00 CEST (París)
Este taller mostrará cómo agregar funcionalidades de análisis de datos en sus aplicaciones PowerBuilder, donde los usuarios examinarán visualmente sus datos mediante el desglose de un gráfico a otro.
Codificaremos algunos ejemplos con los controles PowerChart, introducidos con PowerBuilder Ultimate Suite 2019.
La creación de un gráfico no requiere codificación, se configuran con un asistente. Pero veremos cómo capturar las interacciones del usuario con un gráfico y desencadenar la siguiente acción: abrir otro gráfico para desglosar un valor, por ejemplo.
Todos los asistentes recibirán una copia gratuita de PB Ultimate Suite, para reproducir los gráficos similares y las funciones de desglose con sus propios datos.
Presentador: Franck Fasolin, diseñador de PowerChart
-
Tuesday, June 18, 2019 | at 9:00 EDT PST (New York) / 15H00 PM CET (Paris)
Until now, PB developers generated their Graph with datawindows, which come with a high productivity but limited presentation options.
This webcast introduce a new toolset to build modern, beautiful charts, while still leveraging the power of datawindows for data manipulations.
All participants will receive a free copy of this toolset, to generate graphs with their own data.
-
Thursday October 10, 2019 | at 10:00 AM EDT (New York) - 16:00 CEST (Paris)
This workshop will show how to add data analytics capabilities in your PowerBuilder applications, where users will visually analyze their data by drilling down from one Charts to another.
We will code a few examples with the PowerChart controls, introduced with PowerBuilder Ultimate Suite 2019.
Creating a chart does not require coding, they are configured with a painter. But we will see how to capture the interactions of the user with a chart, and trigger the next action : open another Chart to break down a value for instance.
All attendees will receive a free copy of the PowerBuilder Ultimate Suite, to reproduce the similar charts and drill down features with their own data.
Presenters: Franck Fasolin, designer of PowerChart
-
-
Jeudi 10 Octobre 2019 | à 10:00 AM EDT (New York) - 16:00 CEST (Paris)
Cet atelier montrera comment ajouter des fonctionnalités d'analyse de données dans vos applications PowerBuilder. Les utilisateurs pourront analyser visuellement leurs données en passant d'un graphique à l'autre.
Nous coderons quelques exemples avec les contrôles PowerChart, disponibles avec PowerBuilder Ultimate Suite 2019.
La création d'un graphique ne nécessite pas de code, ils sont configurés avec un assistant.
Nous verrons cependant comment capturer les actions de l'utilisateur sur un graphique, et déclencher l'action suivante : ouvrir un autre graphique pour décomposer une valeur par exemple.Tous les participants recevront une copie gratuite de PB Ultimate Suite, afin de reproduire les graphiques similaires et les fonctions de zoom avant avec leurs propres données.
Intervenant : Franck Fasolin, concepteur de PowerChart
-
Tuesday, November 5, 2019 | at 10:00 AM EDT (New York) / 16H00 CET (Paris)
This workshop will show how to build a modern Dashboard in your PowerBuilder application, composed on animated Charts and datawindows, for data visualization purposes.
We will see how to create and configure Chart without coding, by running a chart painter from the PB IDE, then assemble them into a dashboard.
We will also see how to detect that a user clicks on a part of a chart, to implement drill down features and add analytics capabilities to your PB App.
This workshop will leverage PowerChart, a new PB control introduced with PowerBuilder Ultimate Suite 2019.All attendees will receive a free copy of the tool, to reproduce the same manipulations with their own data.
Presenter: Franck Fasolin, designer of PowerChart
-
-
Martes 5 de noviembre de 2019 | a las 10:00 AM EDT (Nueva York) / 16H00 CET
Este taller mostrará cómo construir un Dashboard moderno en su aplicación PowerBuilder, compuesto por gráficos animados y datawindows, para fines de visualización de datos.
Veremos cómo crear y configurar gráficos sin codificación, ejecutando un asistente desde el IDE de PB, y luego ensamblarlos en un panel de control.
También veremos cómo detectar que un usuario hace un clic en una parte de un gráfico, para implementar funciones de drill down y añadir posibilidades de análisis a su aplicación PB.
Este taller se basará en PowerChart, un nuevo control PB introducido con PowerBuilder Ultimate Suite 2019.Presentador: Franck Fasolin, diseñador de PowerChart
-
Mardi 5 novembre 2019 | à 10h00 EDT (New York) / 16H00 CET (Paris)
Cet atelier vous montrera comment construire un tableau de bord moderne dans votre application PowerBuilder, composé de graphiques animés et de datawindows, pour visualiser des données
Nous verrons comment créer et configurer des graphiques sans coder, en utilisant un éditeur de graphiques depuis l'EDI PB, puis les assembler dans un tableau de bord.
Nous verrons également comment détecter qu'un utilisateur clique sur une partie d'un graphique, pour implémenter des fonctions de zoom avant et ajouter des capacités d'analyse à votre application PB.
Cet atelier s'appuiera sur PowerChart, un nouveau contrôle PB lancé avec PowerBuilder Ultimate Suite 2019.Tous les participants recevront une copie gratuite de l'outil, pour reproduire les mêmes manipulations avec leurs propres données.
Intervenant : Franck Fasolin, concepteur de PowerChart
-
Tuesday, September 12, 2023 | at 10:00 AM EST (New York) / 16:00 CET (Paris)
In this webcast, our presenter will guide you through the process of incorporating visually stunning and interactive charts and reports into your PowerBuilder applications.
Through live demonstrations, we will showcase the seamless integration of modern charting and reporting components into your existing PowerBuilder projects.
Highlights of the webcast include:
- Create visually appealing charts, such as line charts, bar charts, pie charts and more, using intuitive graphical controls.
- Customize chart appearance, apply themes
- Create interactive dashboards and enable drill-down functionality to enhance the user experience.
- Q&A session
Presenter: Christophe Dufourmantelle and Frack Fasolin